December 16, 2020
A version of the original comic hopefully better for colorblind people. 2016 · 2020

Original: 2020 Election Map (2399)
View in: (not on forums), direct image link/enlarge
December 16, 2020
A version of the original comic hopefully better for colorblind people. 2016 · 2020

Original: 2020 Election Map (2399)
View in: (not on forums), direct image link/enlarge
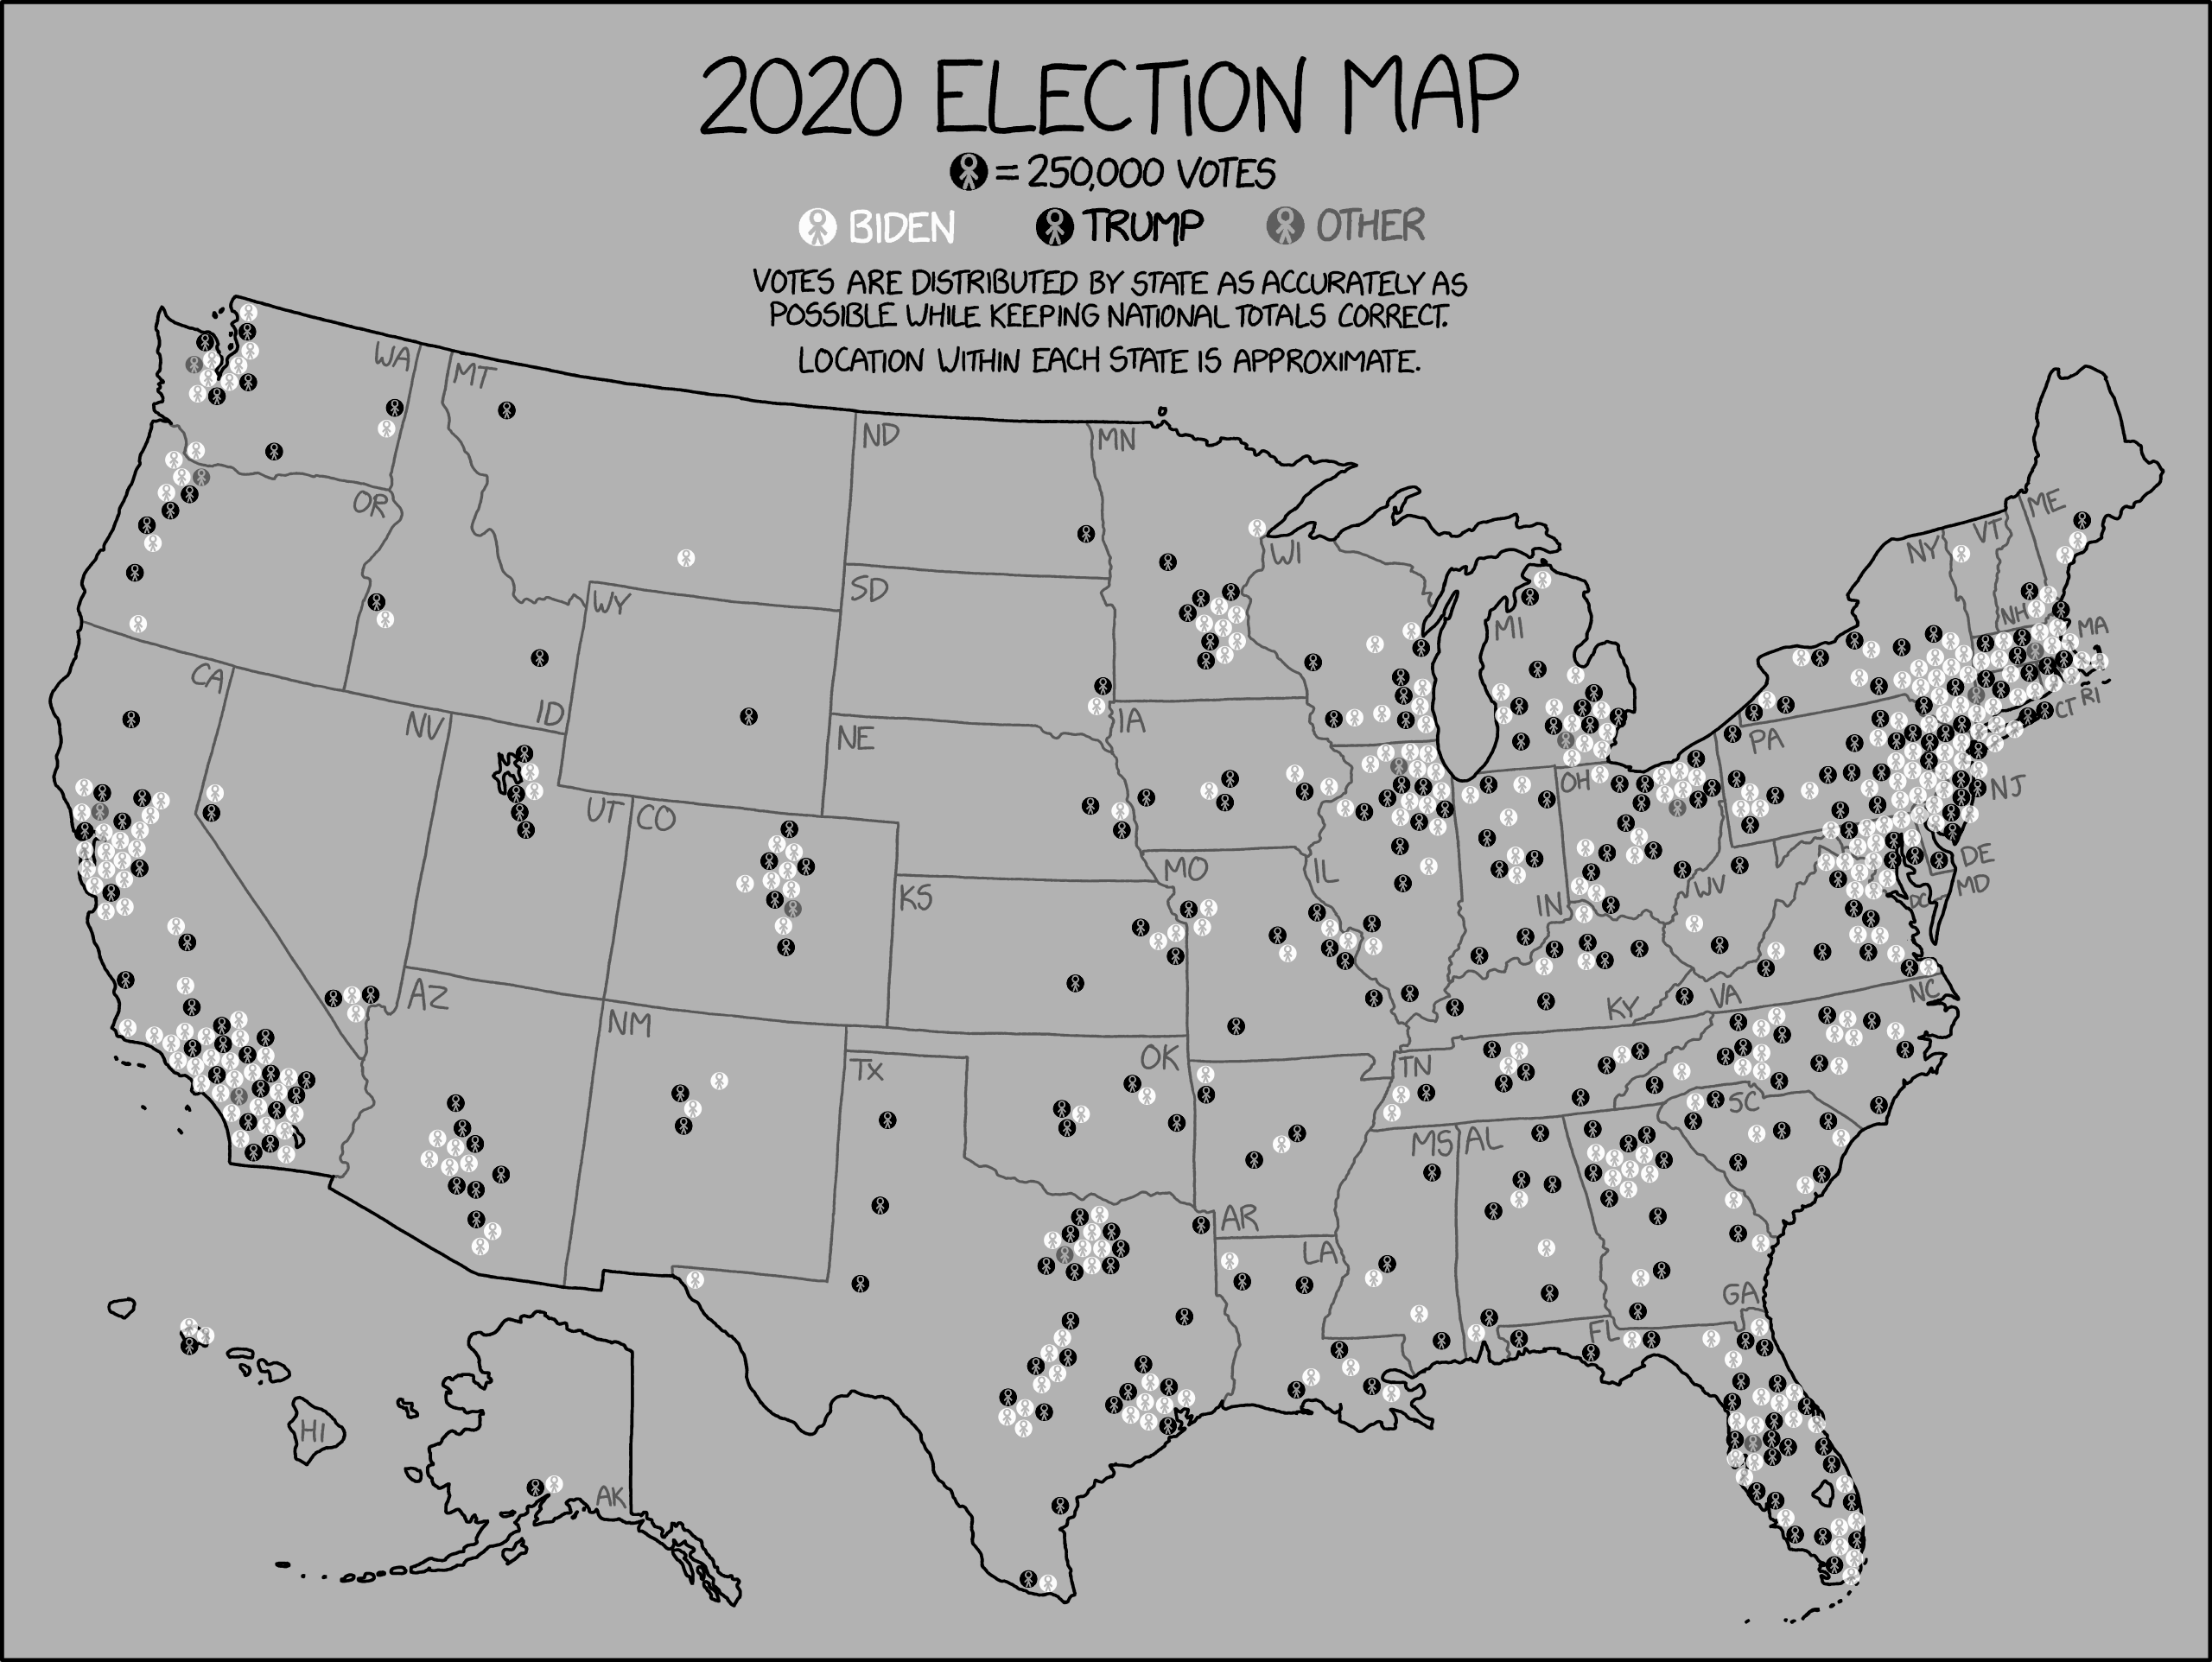
2020 Election Map
(circle with stick figure) = 250,000 votes
White: Biden; Black: Trump; Gray: Other
Votes are distributed by state as accurately as possible while keeping national totals correct.
Location within each state is approximate.
It's a map of the US with a gray background and various black and white and occasionally gray stick figures.
My attempt at describing the distribution: It's pretty similar to 2016, but it looks like there are just overall more people in several places, and some people have moved around. (The rest of this description is copied from 2016 aside from Alaska and Hawaii, and changing Clinton to Biden, and still applies.) The west coast has a somewhat high density of stick figures, with more Biden voters than Trump voters. The rest of the western half of the country appears very sparsely populated, with a couple clusters; there are both Trump and Biden voters there, and I can't tell which has more. The eastern half of the country has a higher density in general, with a cluster of mostly Biden voters in northern Illinois, a large cluster of mostly Biden but some Trump voters in New England (northern part of the east coast), and a mixed cluster in Florida; I can't quite tell which has more voters in the rest of that part of the country. Hawaii has two Biden figures and one Trump figure; Alaska has one of each.
Title text: There are more Trump voters in California than Texas, more Biden voters in Texas than New York, more Trump voters in New York than Ohio, more Biden voters in Ohio than Massachusetts, more Trump voters in Massachusetts than Mississippi, and more Biden voters in Mississippi than Vermont.