Transcript
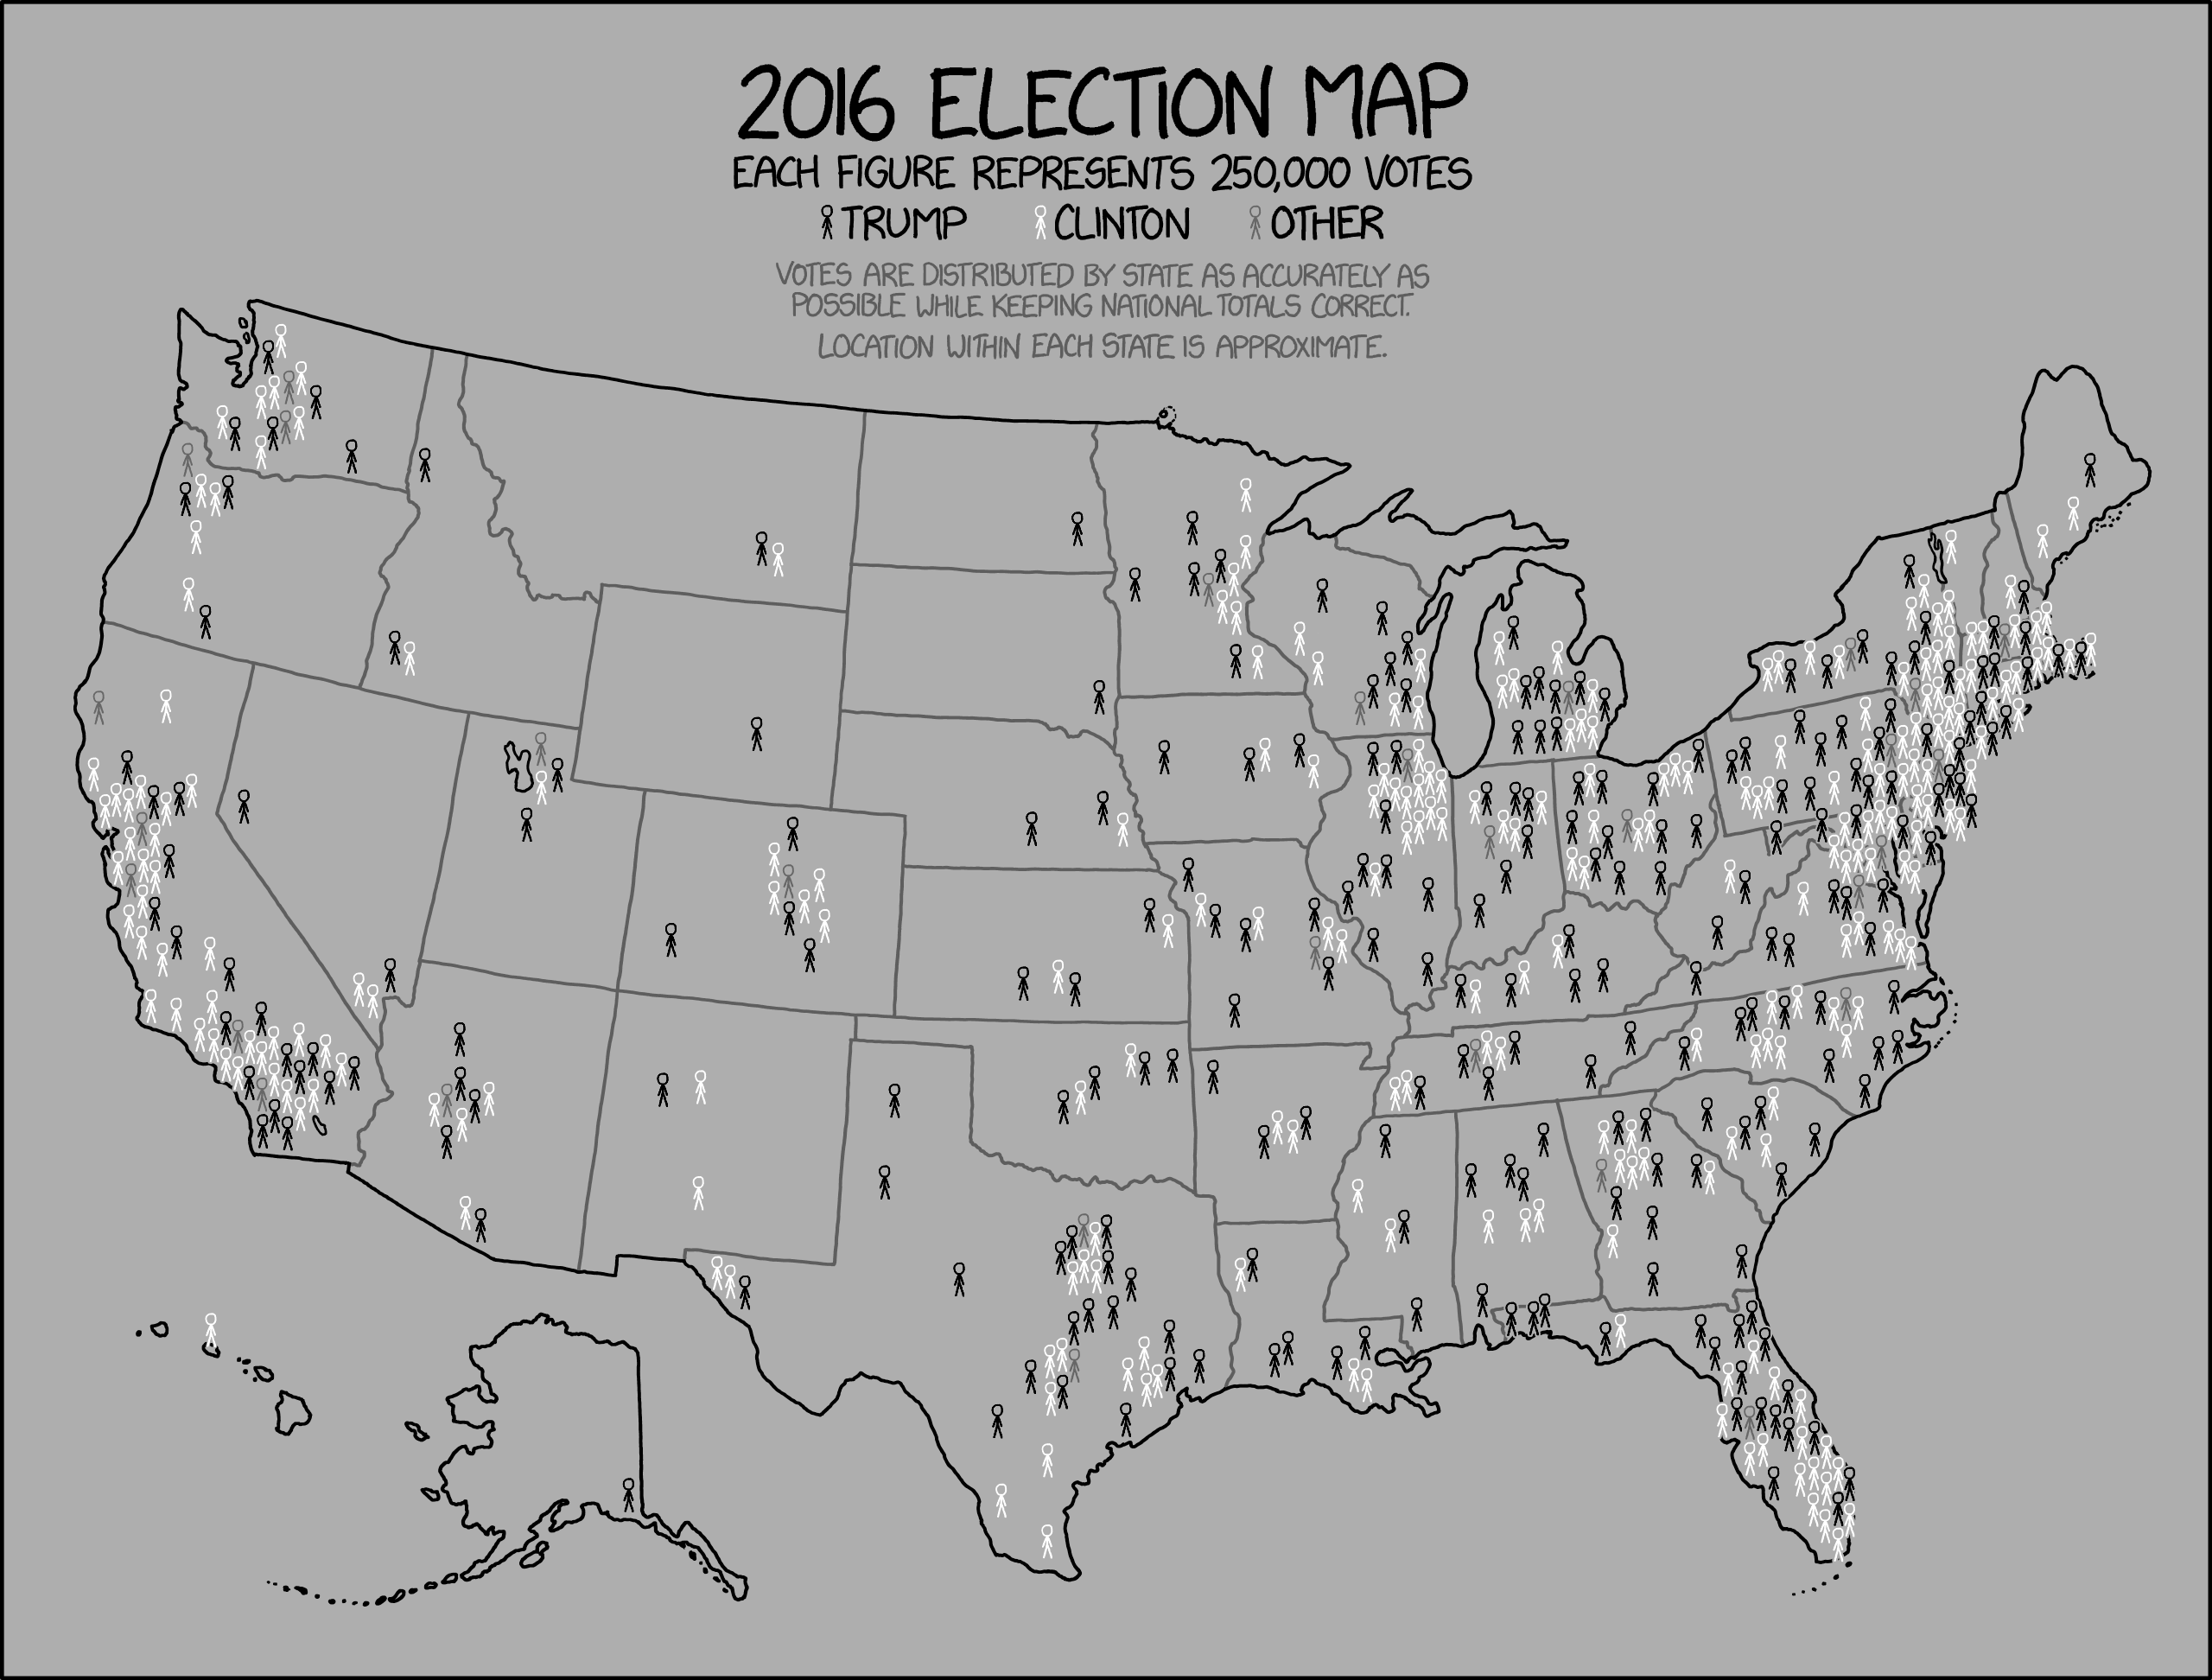
2016 Election Map
Each figure represents 250,000 votes
Black: Trump; White: Clinton; Gray: Other
Votes are distributed by state as accurately as possible while keeping national totals correct.
Location within each state is approximate.
It's a map of the US with a gray background and various black and white and occasionally gray stick figures.
My attempt at describing the distribution: The west coast has a somewhat high density of stick figures, with more Clinton voters than Trump voters. The rest of the western half of the country appears very sparsely populated, with a couple clusters; there are both Trump and Clinton voters there, and I can't tell which has more. The eastern half of the country has a higher density in general, with a cluster of mostly Clinton voters in northern Illinois, a large cluster of mostly Clinton but some Trump voters in New England (northern part of the east coast), and a mixed cluster in Florida; I can't quite tell which has more voters in the rest of that part of the country. Hawaii and Alaska each have a single figure; Hawaii's is Clinton, and Alaska's is Trump.
(no title text)

